Financial Data
Financial Highlights
| Consolidated financial results (JGAAP) | FY2020 (Actual) |
FY2021 (Actual) |
FY2022 (Actual) |
FY2023 (Actual) |
FY2024 (Forecast) |
|---|---|---|---|---|---|
|
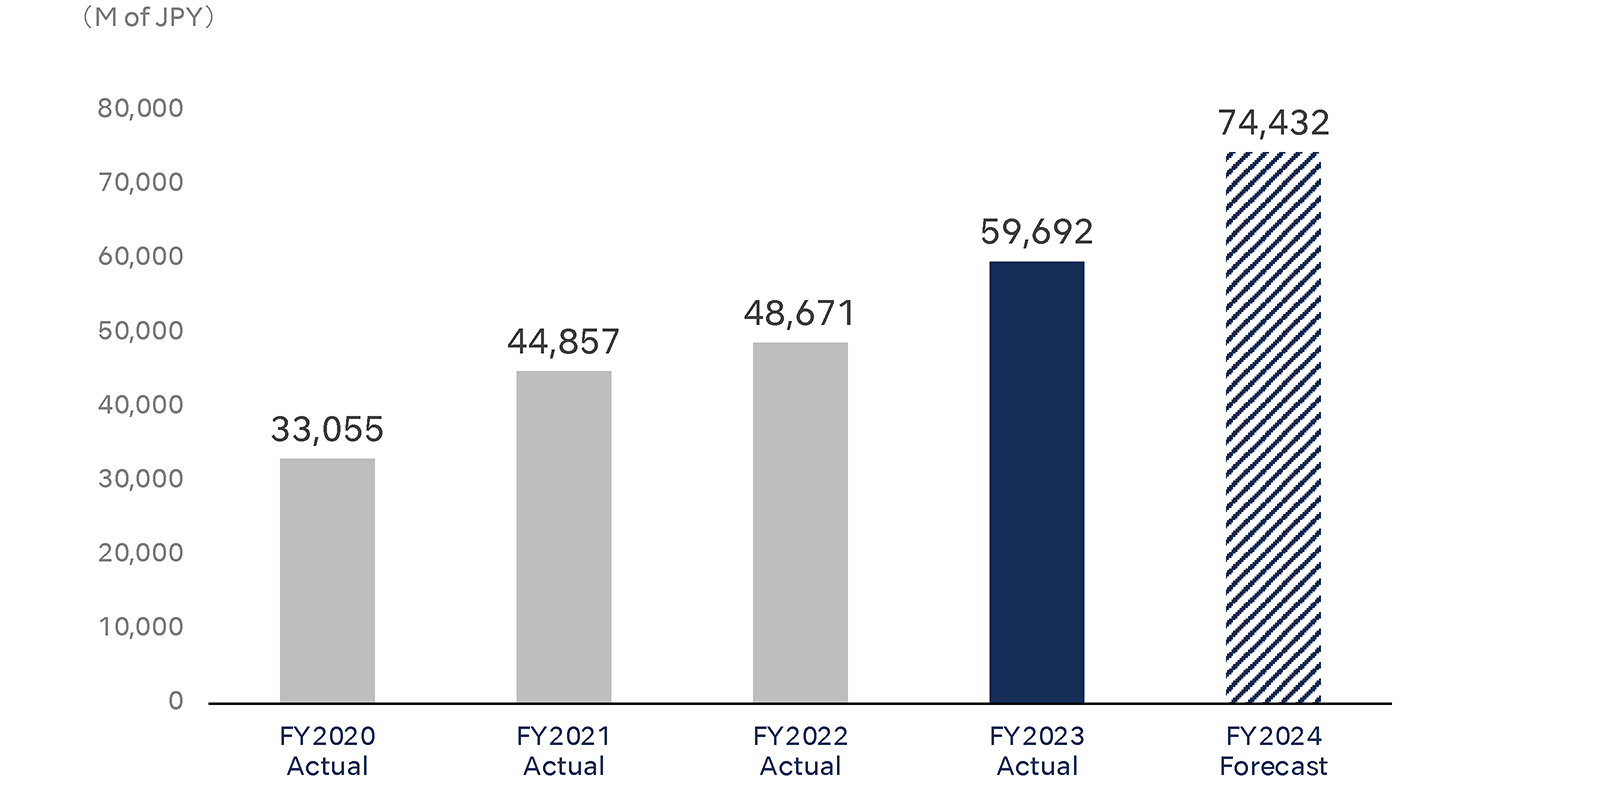
Net salesMillions of JPY |
33,055 | 44,857 | 48,671 | 59,692 | 74,432 |
|
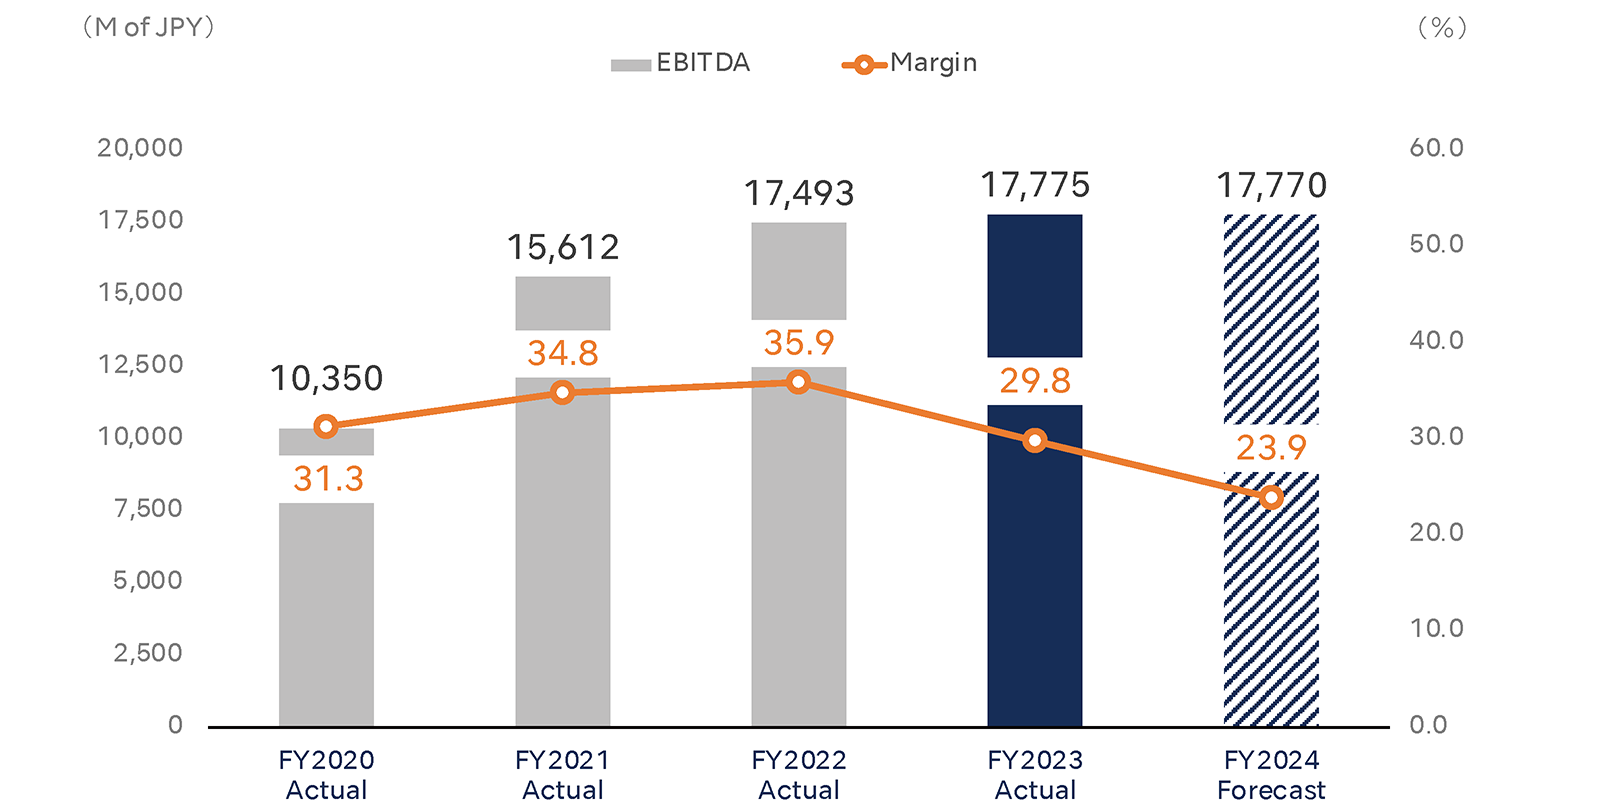
EBITDAMillions of JPY |
10,350 | 15,612 | 17,493 | 17,775 | 17,770 |
|
EBITDA Margin % |
31.3 | 34.8 | 35.9 | 29.8 | 23.9 |
|
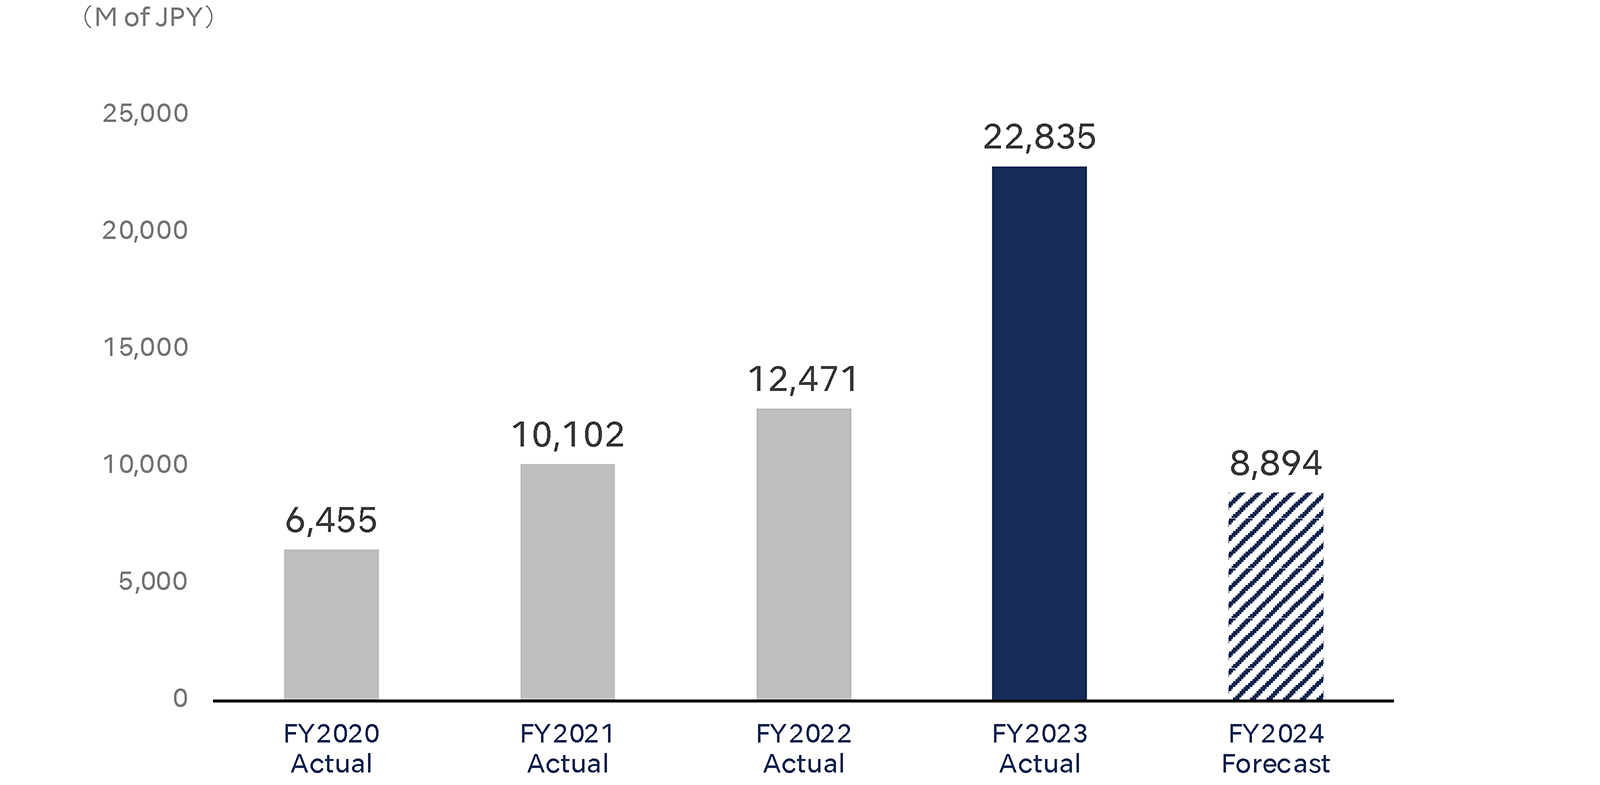
Profit attributable to owners of parentMillions of JPY |
6,455 | 10,102 | 12,471 | 22,835 | 8,894 |
|
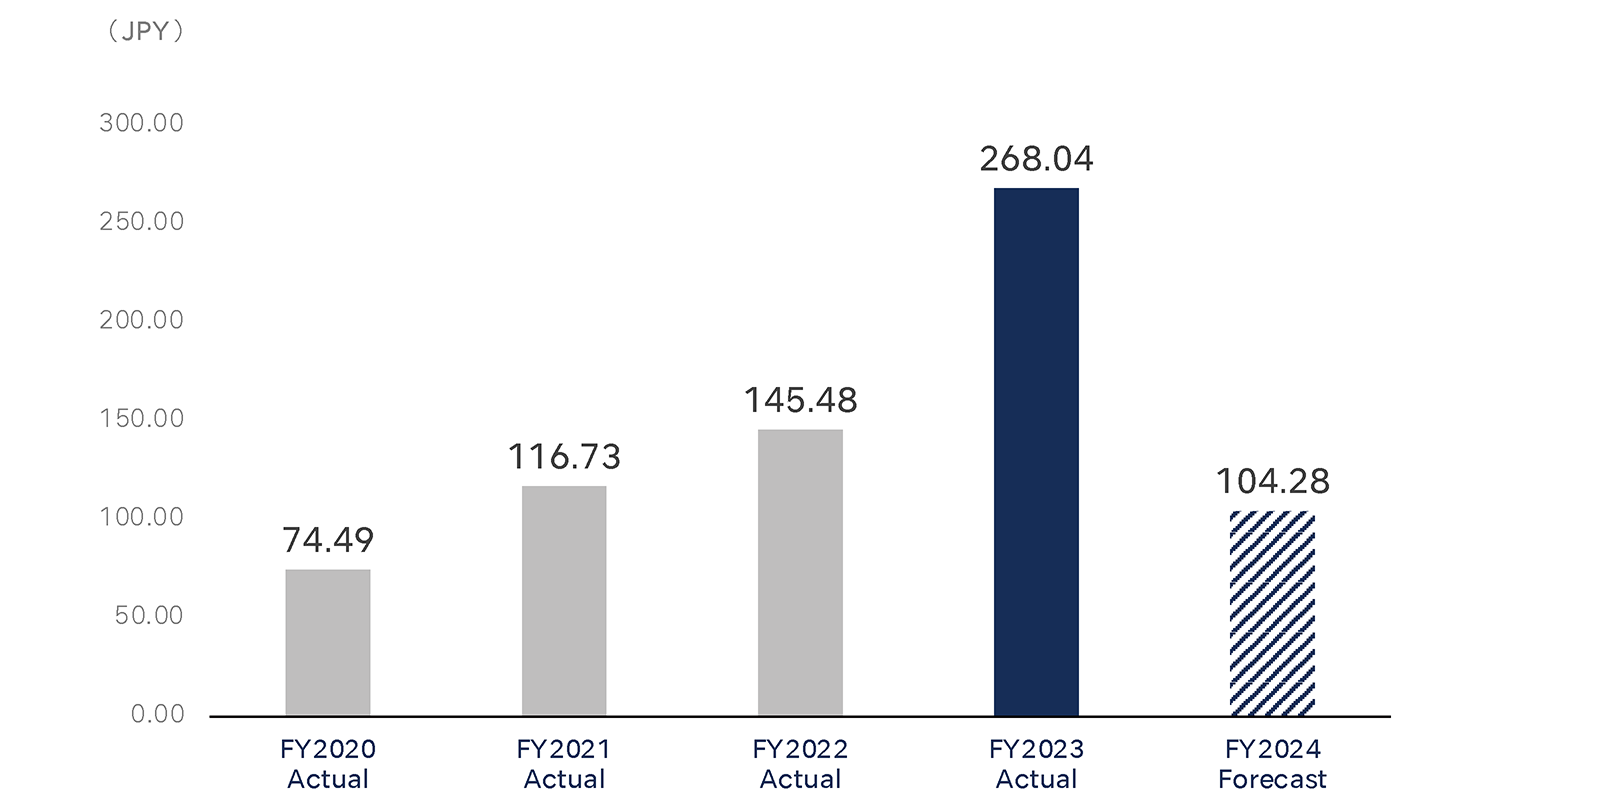
Earnings per share JPY |
74.49 | 116.73 | 145.48 | 268.04 | 104.28 |
Net sales
EBITDA / Margin
Profit attributable to owners of parent
EPS
Key Financial Data
| Consolidated financial results (JGAAP) | FY2019 Actual |
FY2020 Actual |
FY2021 Actual |
FY2022 Actual |
FY2023 Actual |
|---|---|---|---|---|---|
|
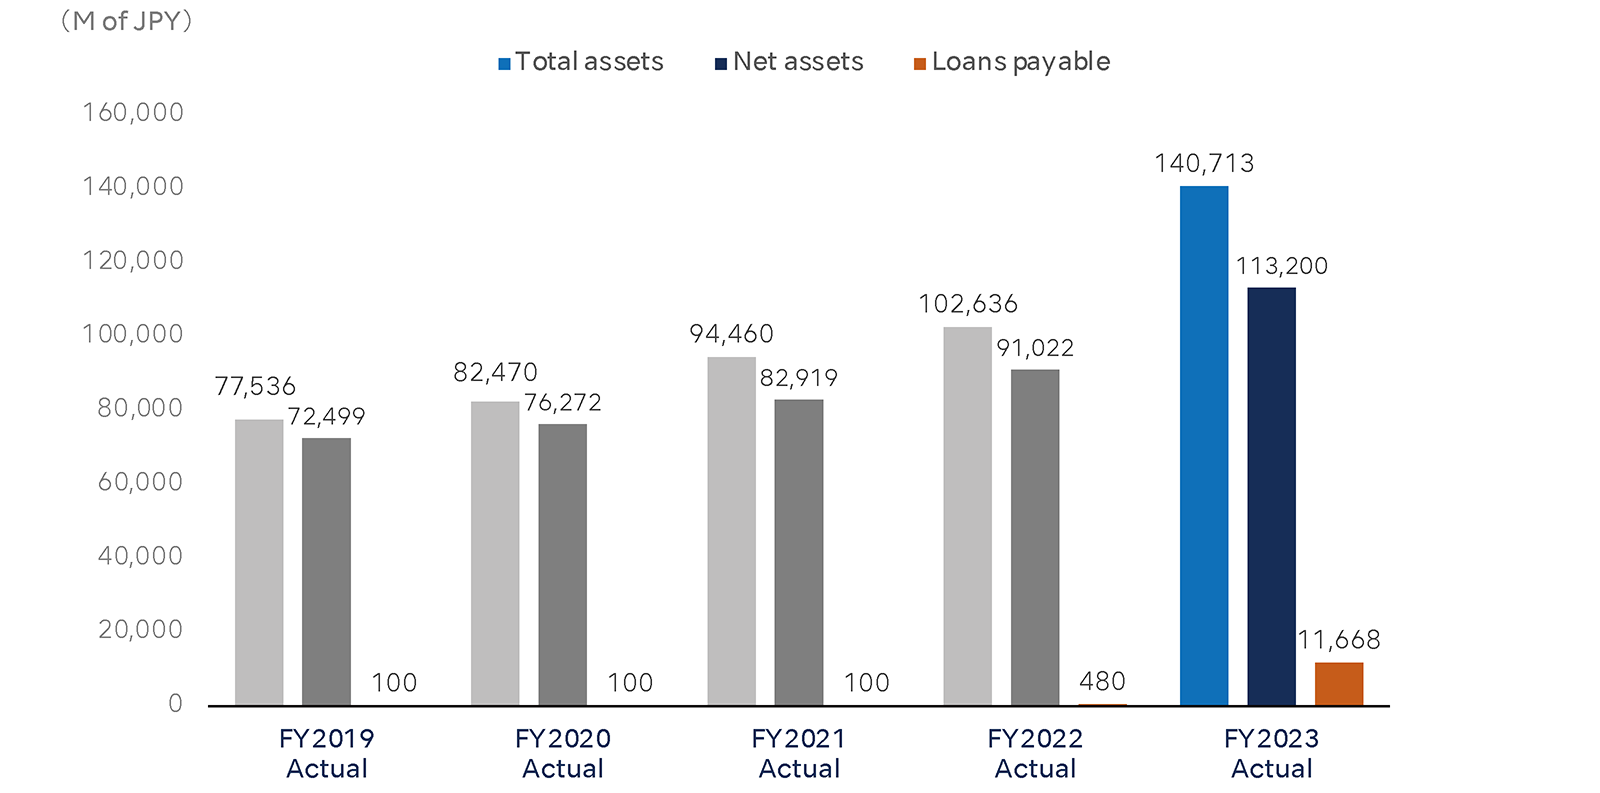
Total assetsMillions of JPY |
77,536 | 82,470 | 94,460 | 102,154 | 140,713 |
|
Net assetsMillions of JPY |
72,499 | 76,272 | 82,919 | 91,022 | 113,200 |
|
Loans payableMillions of JPY |
100 | 100 | 100 | 480 | 11,668 |
|
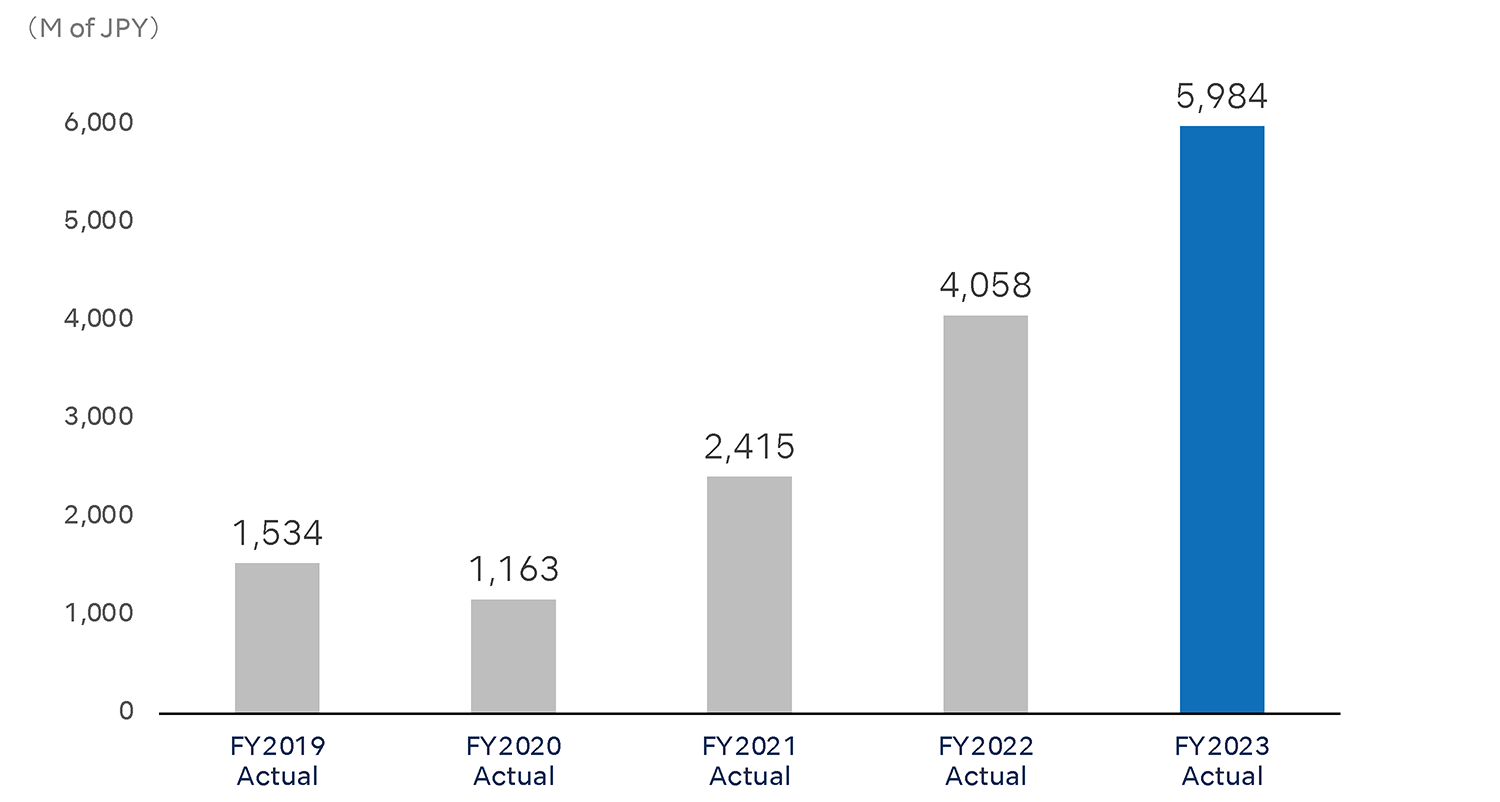
Capital investmentsMillions of JPY |
1,534 | 1,163 | 2,415 | 4,058 | 5,984 |
|
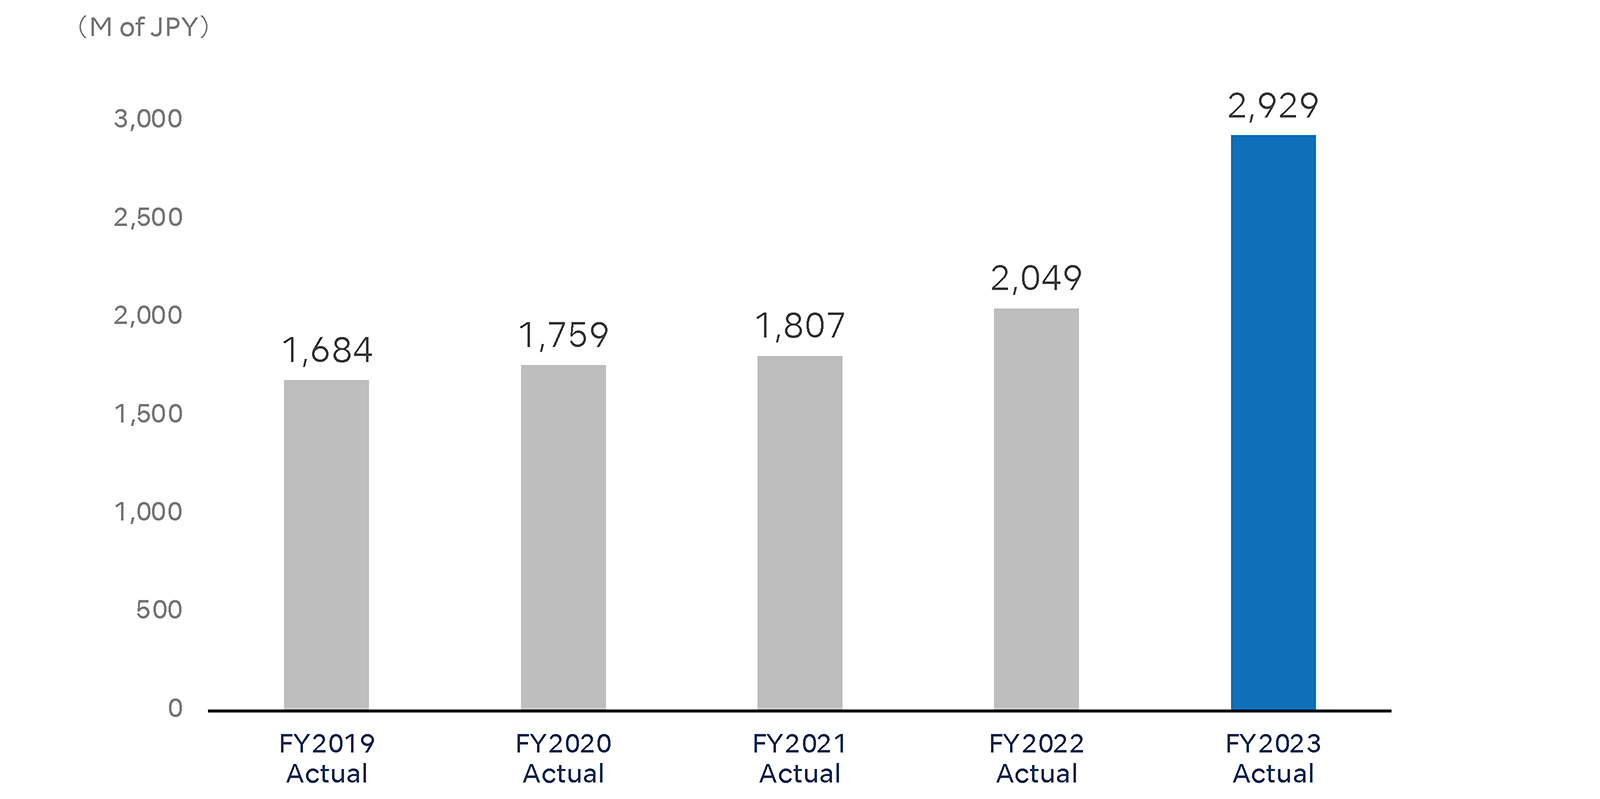
Depreciation expensesMillions of JPY |
1,684 | 1,759 | 1,807 | 2,049 | 2,929 |
|
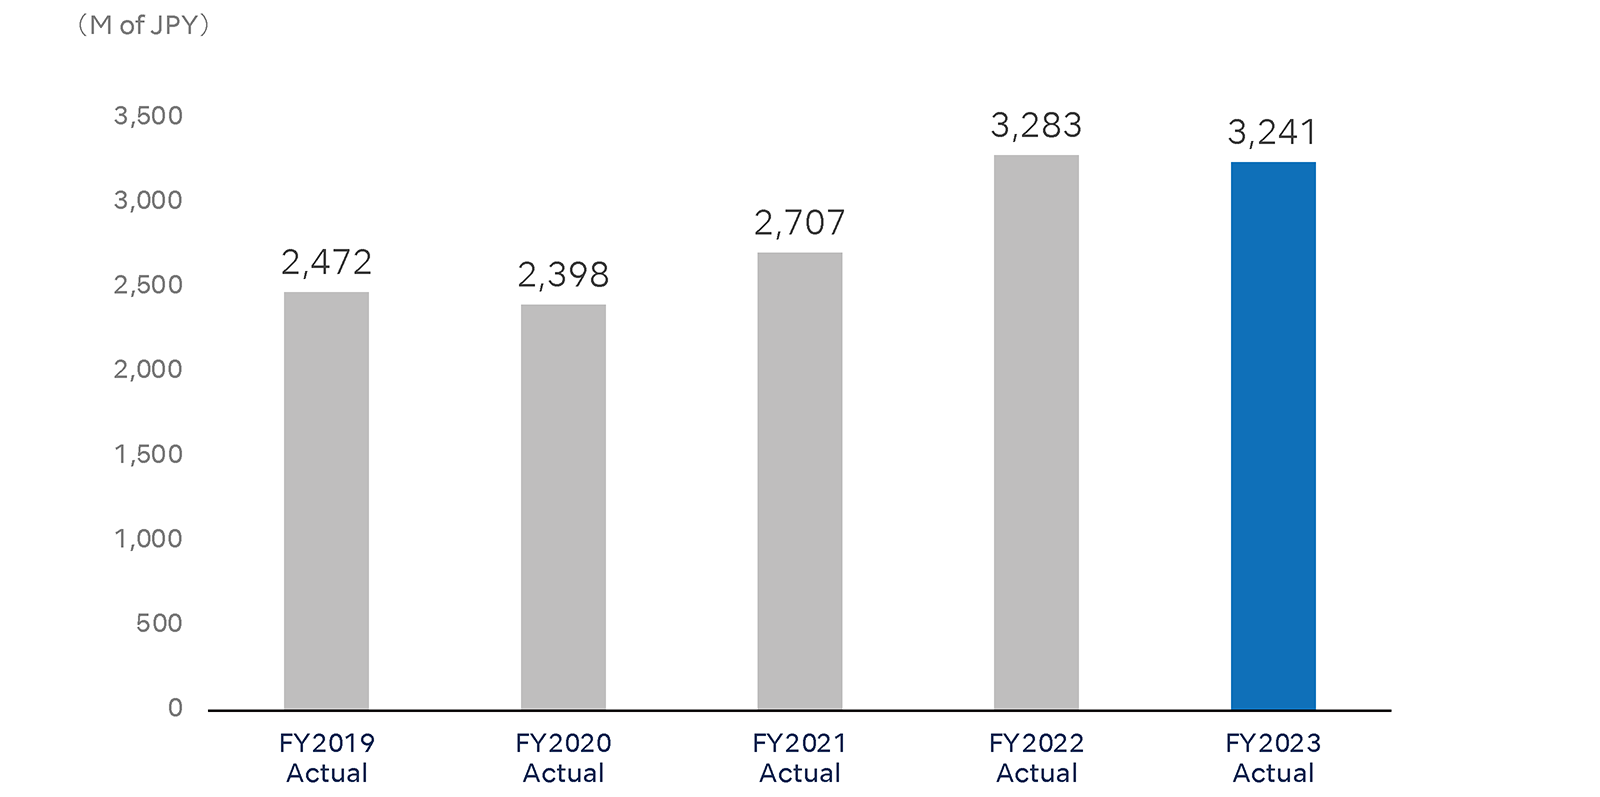
R&D expensesMillions of JPY |
2,472 | 2,398 | 2,707 | 3,283 | 3,241 |
|
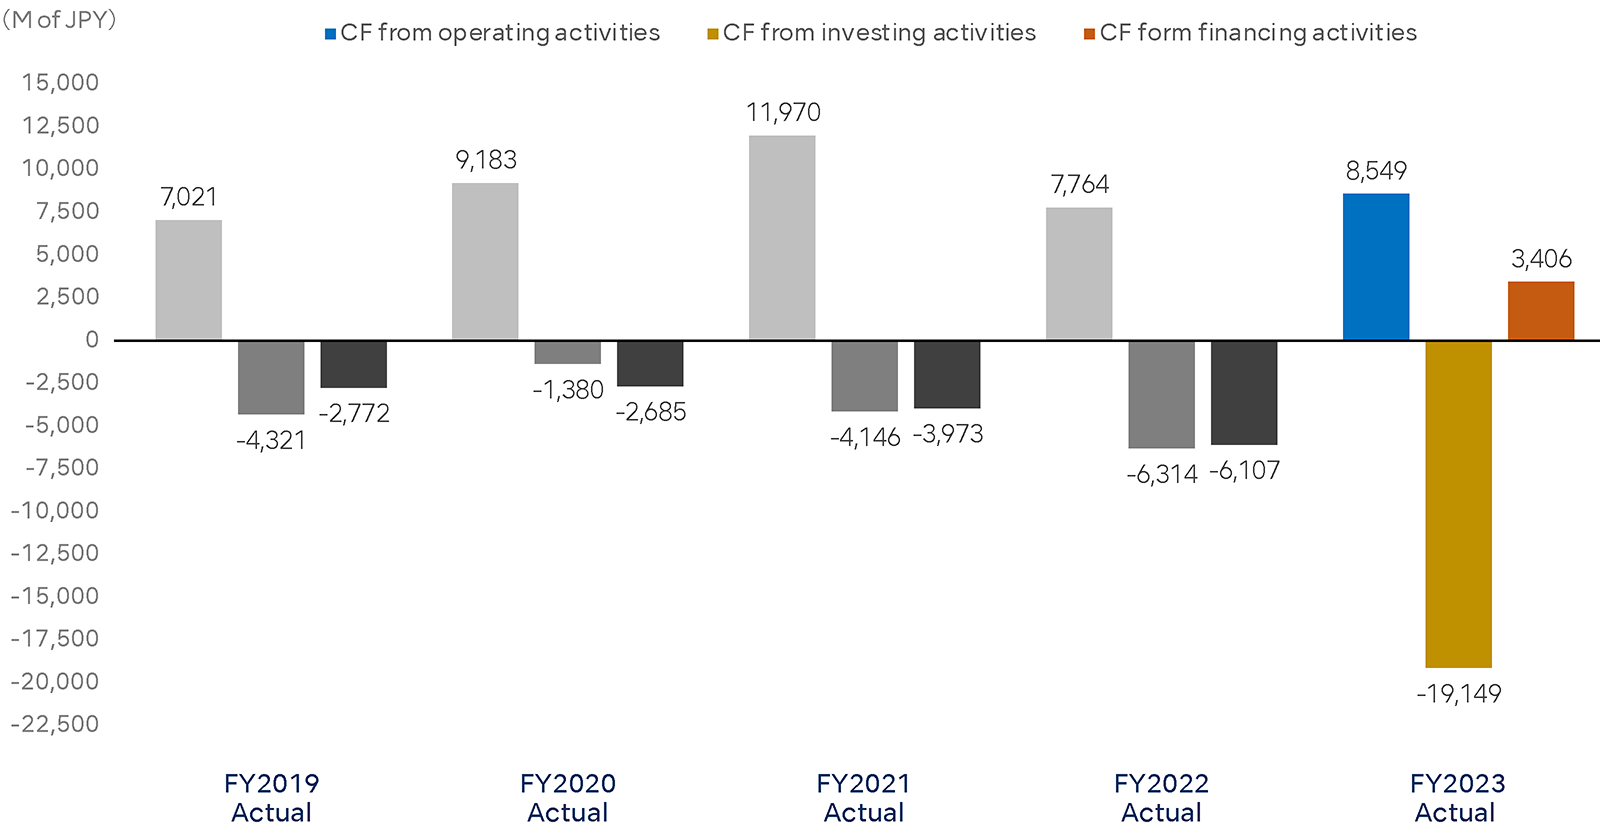
Cash flows from operating activitiesMillions of JPY |
7,021 | 9,183 | 11,970 | 7,764 | 8,549 |
|
Cash flows from investing activitiesMillions of JPY |
-4,321 | -1,380 | -4,146 | -6,314 | -19,149 |
|
Cash flows from financing activitiesMillions of JPY |
-2,772 | -2,685 | -3,973 | -6,107 | 3,406 |
Total assets・Net assets・Loans payable
Capital investments
Depreciation expenses
R&D expenses
Cash flows from operating activities・investing activities・financing activities
Financial Position
| Consolidated financial results (JGAAP) | FY2019 Actual |
FY2020 Actual |
FY2021 Actual |
FY2022 Actual |
FY2023 Actual |
|---|---|---|---|---|---|
|
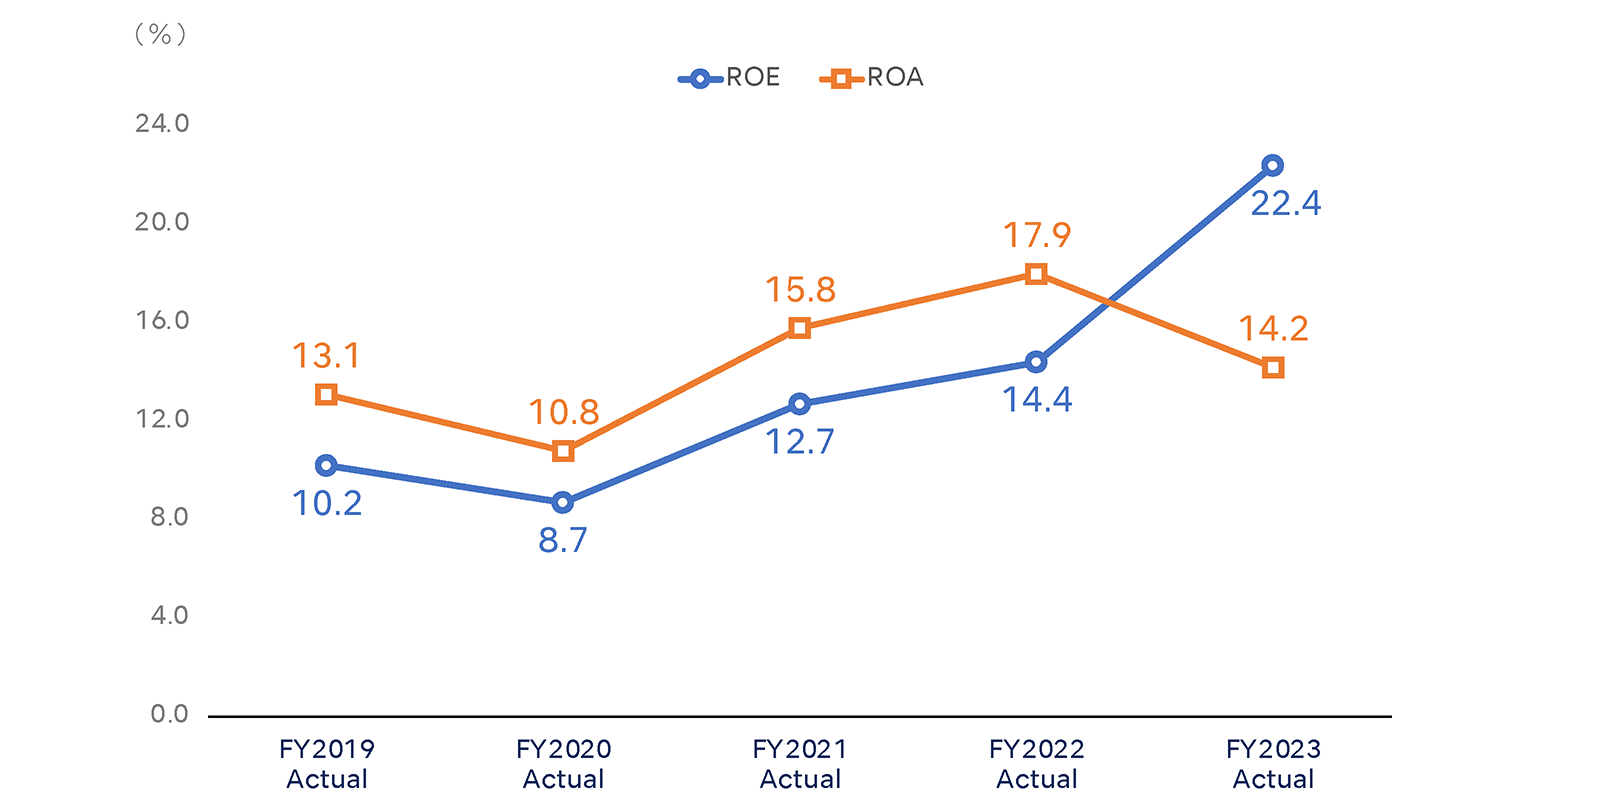
Return on equity (ROE) % |
10.2 | 8.7 | 12.7 | 14.4 | 22.4 |
|
Return on assets (ROA) % |
13.1 | 10.8 | 15.8 | 17.9 | 14.2 |
|
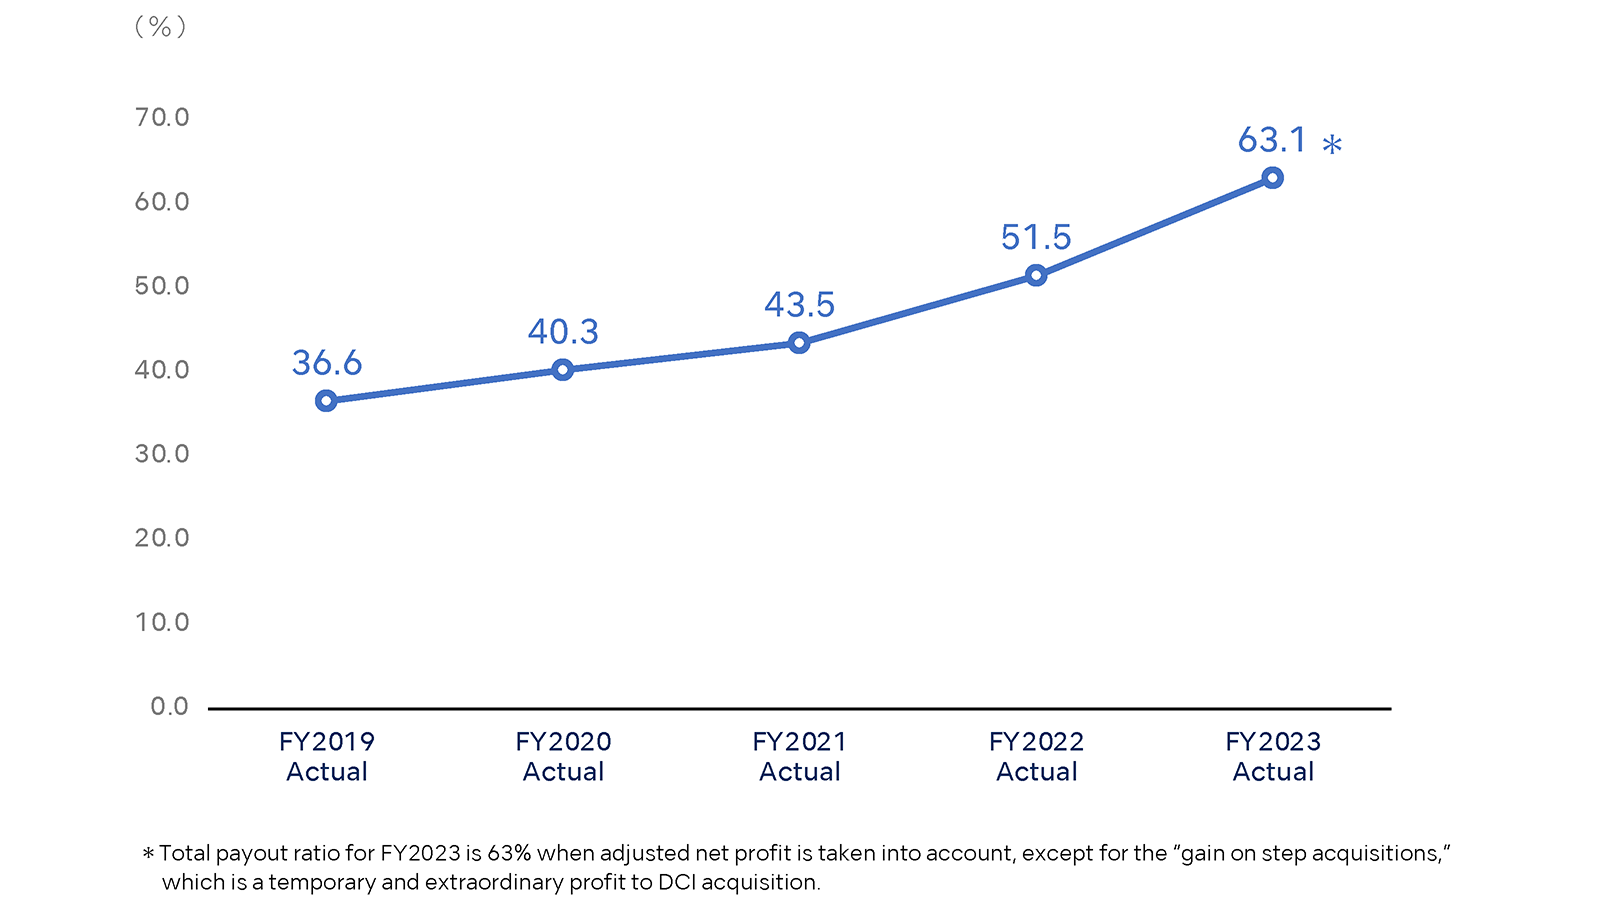
Total payout ratio % |
36.6 | 40.3 | 43.5 | 51.5 | 63.1 |
|
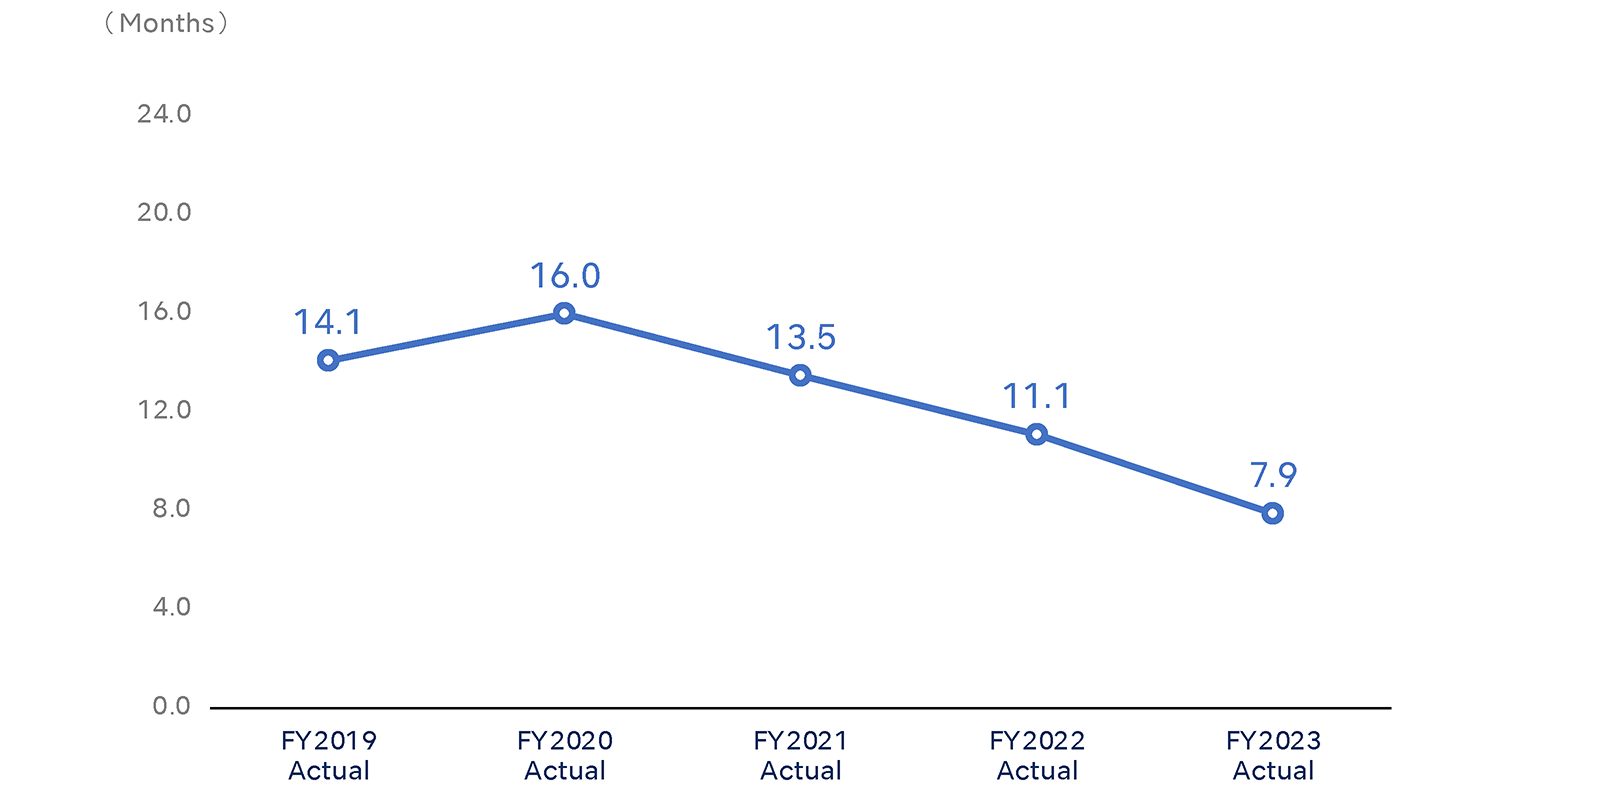
Cash & marketable securities to monthly sales ratio Months |
14.1 | 16.0 | 13.5 | 11.1 | 7.9 |
- ROE = Profit attributable to owners of parent / Average net assets
- ROA = Ordinary profit / Average total assets
- Total payout ratio = (Total annual dividend + Total amount of repurchase costs) / Profit attributable to owners of parent
- Cash & marketable securities to monthly sales ratio = (Cash + Money held in trust + marketable securities + Investment securities) / (Net sales / 12 months)
ROE・ROA
Total payout ratio
Cash & marketable securities to monthly sales ratio